Tolerancing - Monte Carlo Simulations
[1]:
from optiland.samples.objectives import CookeTriplet
from optiland.tolerancing.core import Tolerancing
from optiland.tolerancing.monte_carlo import MonteCarlo
from optiland.tolerancing.perturbation import DistributionSampler
[2]:
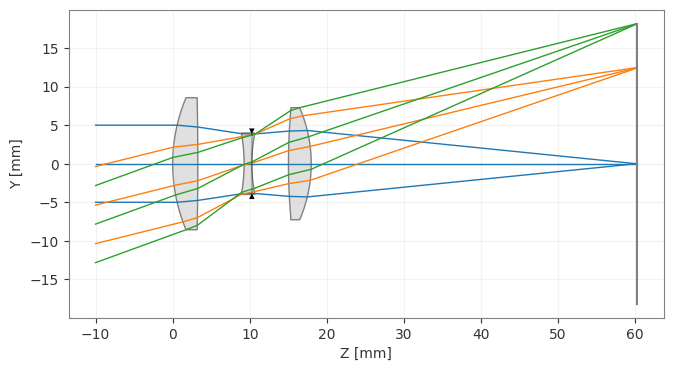
optic = CookeTriplet()
optic.draw()
[2]:
(<Figure size 1000x400 with 1 Axes>, <Axes: xlabel='Z [mm]', ylabel='Y [mm]'>)
[3]:
tolerancing = Tolerancing(optic)
[4]:
# loop through all surfaces and add perturbations
for k in range(1, 7):
    # X-tilt
    sampler = DistributionSampler("normal", loc=0, scale=0.01)
    tolerancing.add_perturbation("tilt", sampler, surface_number=k, axis="x")

    # Y-tilt
    sampler = DistributionSampler("normal", loc=0, scale=0.01)
    tolerancing.add_perturbation("tilt", sampler, surface_number=k, axis="y")

    # X-decenter
    sampler = DistributionSampler("normal", loc=0, scale=0.1)
    tolerancing.add_perturbation("decenter", sampler, surface_number=k, axis="x")

    # Y-decenter
    sampler = DistributionSampler("normal", loc=0, scale=0.1)
    tolerancing.add_perturbation("decenter", sampler, surface_number=k, axis="y")
Define operands:
[5]:
input_data = {
    "optic": optic,
    "surface_number": -1,
    "Hx": 0,
    "Hy": 1,
    "wavelength": 0.55,
    "num_rays": 5,
}
tolerancing.add_operand("rms_spot_size", input_data, target=0)

input_data = {"optic": optic, "Hx": 0, "Hy": 1, "wavelength": 0.55, "num_rays": 5}
tolerancing.add_operand("OPD_difference", input_data)

input_data = {
    "optic": optic,
    "surface_number": -1,
    "Hx": 0,
    "Hy": 1,
    "Px": 0,
    "Py": 0,
    "wavelength": 0.55,
}
tolerancing.add_operand("real_y_intercept", input_data)
[6]:
monte_carlo = MonteCarlo(tolerancing)
[7]:
monte_carlo.run(num_iterations=1000)
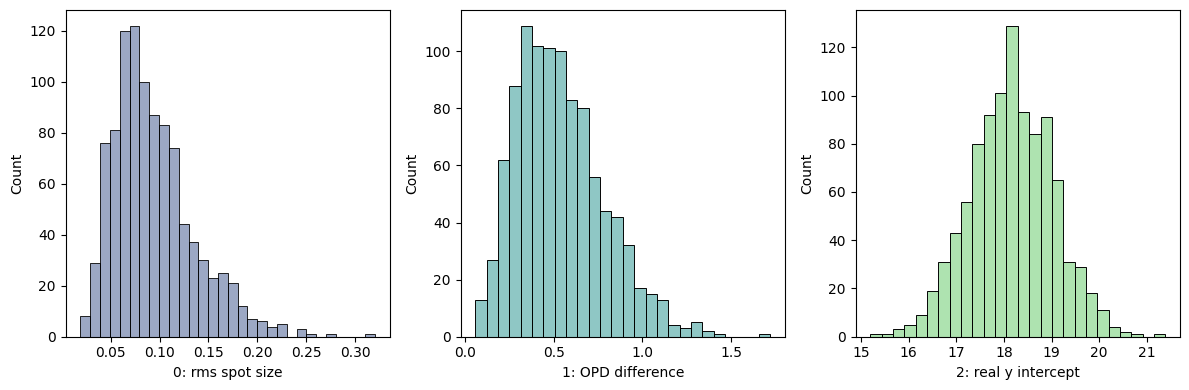
[8]:
monte_carlo.view_histogram(kde=False)
[8]:
(<Figure size 1200x400 with 3 Axes>,
 array([<Axes: xlabel='0: rms spot size', ylabel='Count'>,
        <Axes: xlabel='1: OPD difference', ylabel='Count'>,
        <Axes: xlabel='2: real y intercept', ylabel='Count'>], dtype=object))
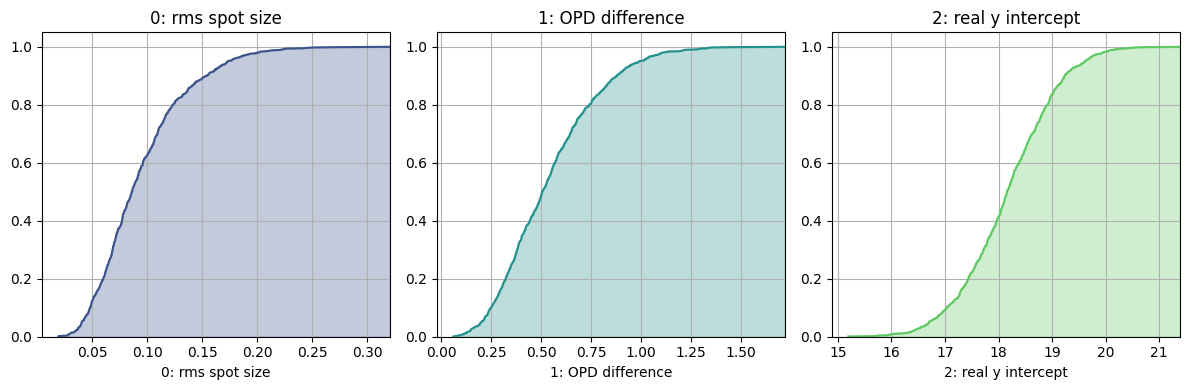
[9]:
monte_carlo.view_cdf()
[9]:
(<Figure size 1200x400 with 3 Axes>,
 array([<Axes: title={'center': '0: rms spot size'}, xlabel='0: rms spot size'>,
        <Axes: title={'center': '1: OPD difference'}, xlabel='1: OPD difference'>,
        <Axes: title={'center': '2: real y intercept'}, xlabel='2: real y intercept'>],
       dtype=object))
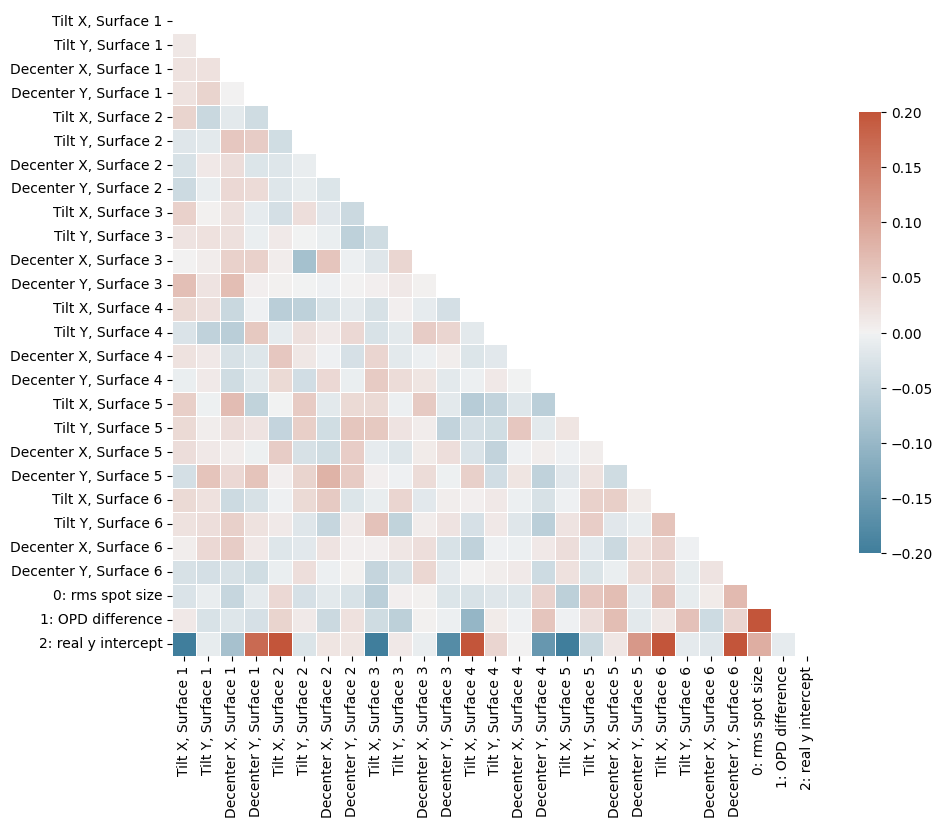
[10]:
monte_carlo.view_heatmap(vmin=-0.2, vmax=0.2, figsize=(10, 10))
[10]:
(<Figure size 1000x1000 with 2 Axes>, <Axes: >)
Get pandas dataframe:
[11]:
df = monte_carlo.get_results()
[12]:
df.head()
[12]:
| Tilt X, Surface 1 | Tilt Y, Surface 1 | Decenter X, Surface 1 | Decenter Y, Surface 1 | Tilt X, Surface 2 | Tilt Y, Surface 2 | Decenter X, Surface 2 | Decenter Y, Surface 2 | Tilt X, Surface 3 | Tilt Y, Surface 3 | ... | Tilt Y, Surface 5 | Decenter X, Surface 5 | Decenter Y, Surface 5 | Tilt X, Surface 6 | Tilt Y, Surface 6 | Decenter X, Surface 6 | Decenter Y, Surface 6 | 0: rms spot size | 1: OPD difference | 2: real y intercept | |
|---|---|---|---|---|---|---|---|---|---|---|---|---|---|---|---|---|---|---|---|---|---|
| 0 | 0.017101 | 0.004347 | 0.062023 | -0.024010 | 0.009357 | -0.009618 | 0.177260 | 0.002227 | 0.000371 | -0.002458 | ... | 0.007942 | -0.013222 | 0.039562 | 0.004838 | 0.025309 | 0.244792 | 0.066258 | 0.106817 | 0.526503 | 17.950359 |
| 1 | 0.008688 | 0.007426 | -0.065470 | -0.059611 | 0.002687 | 0.001223 | 0.032123 | 0.026973 | -0.012476 | 0.000293 | ... | -0.002570 | -0.138804 | 0.083596 | -0.017014 | 0.008544 | 0.079301 | -0.048180 | 0.019086 | 0.100060 | 17.579841 |
| 2 | -0.016516 | 0.006235 | 0.011653 | 0.221212 | 0.002248 | 0.011009 | 0.053946 | 0.226214 | 0.011375 | -0.011319 | ... | -0.012501 | -0.100817 | -0.156901 | 0.012034 | -0.011094 | 0.054170 | -0.021322 | 0.038273 | 0.268324 | 18.949907 |
| 3 | -0.003050 | 0.008699 | 0.001844 | 0.073871 | -0.007099 | -0.001430 | -0.170168 | -0.022760 | -0.015863 | -0.013193 | ... | -0.005998 | 0.137115 | -0.079970 | 0.011045 | 0.009429 | -0.035159 | 0.147585 | 0.109370 | 0.940473 | 19.710776 |
| 4 | 0.009338 | 0.009694 | -0.079002 | -0.250629 | 0.003639 | -0.015144 | -0.109551 | 0.091593 | -0.001599 | 0.005951 | ... | -0.004353 | -0.021168 | -0.098273 | 0.002178 | -0.014339 | -0.013662 | 0.050109 | 0.096594 | 0.597469 | 17.468444 |
5 rows × 27 columns