class DysonSpectrometer(optic.Optic):
"""Dyson imaging spectrometer
J. Dyson "Unit Magnification Optical system without Seidel aberrations"
J. Opt. Soc. Am. 49, 713-716 (1959)
"""
def __init__(self):
super().__init__()
self.surfaces.add(index=0, radius=np.inf, thickness = 18.0)
self.surfaces.add(index=1, radius=135.903, thickness=33.53, material="N-BK7",aperture = 60)
self.surfaces.add(index=2, radius=-67.699, thickness=60.668, aperture = 60)
self.surfaces.add(index=3, radius=-51.467, thickness=8.413, material="N-BK7", aperture = 50)
self.surfaces.add(index=4, radius=-65.577, thickness=39.389, aperture = 50, conic = -0.132)
self.surfaces.add(
index=5,
radius=-154.020,
thickness=-39.389,
material = "mirror",
surface_type="grating",
grating_order = 1,
grating_period = 10.0,
groove_grating_angle = 0.0*np.pi,
is_stop=True,
)
self.surfaces.add(index=6, radius=-65.577, thickness=-8.413, material="N-BK7", aperture = 50, conic = -0.132)
self.surfaces.add(index=7, radius=-51.467, thickness=-60.668, aperture = 50)
self.surfaces.add(index=8, radius=-67.699, thickness=-33.53, material="N-BK7",aperture = 60)
self.surfaces.add(index=9, radius=135.903, thickness = -18.0,aperture = 60)
self.surfaces.add(index=10)
# add aperture
self.set_aperture(aperture_type="float_by_stop_size", value=40)
# add field
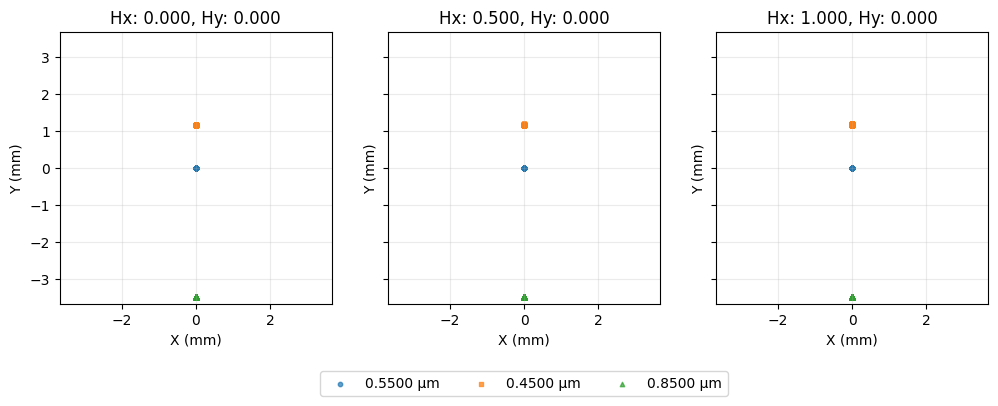
self.fields.set_type(field_type="object_height")
self.fields.add(x=0,y=0)
self.fields.add(x=10,y=0)
self.fields.add(x=20,y=0)
#self.fields.add(x=-20,y=0)
# add wavelength
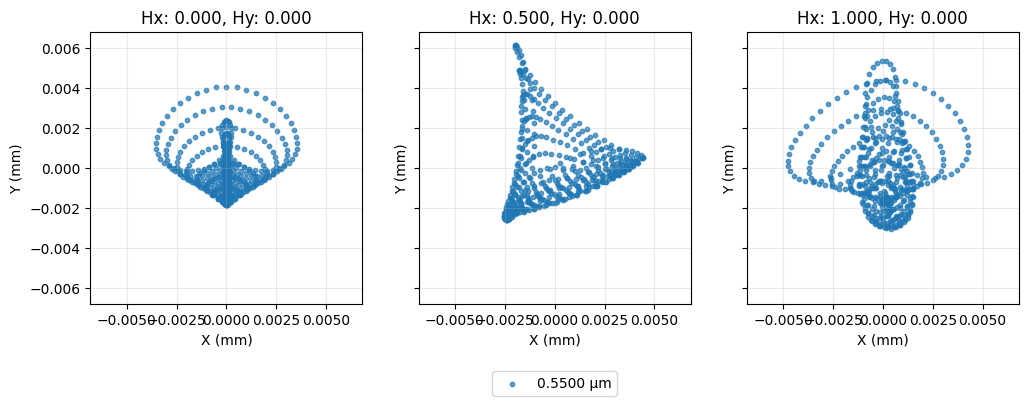
self.wavelengths.add(value=0.550, is_primary=True)
self.wavelengths.add(value=0.450)
self.wavelengths.add(value=0.850)